

Signals from production
Each monitored machine or production point sends a signal describing production progress to the field device.
Stops from signals
The system detects production downtime using thresholds and monitoring schedules — without manual logging for every stop.
Reasons by classification
Staff select a reason and add disturbance detail. Utilization and lost time are based on these practical classifications.
For manufacturing companies that need lost time visible quickly
Shop-floor production
Track lines, cells, and machines by measuring production progress directly from production points.
- Machines, lines, and production areas
- State, pulse, and heartbeat signals
Production management
Plant-wide overview: where production is running, where it is stopped, and why time is lost.
- Dashboard and top losses
- AI analysis for any period
Shifts and responsible users
Classify stop reasons according to your responsibilities. Reminders for unclassified stops.
- Quick classification from the list
- Mobile classification in the browser
When lost production time stays invisible or relies on estimates
Typical current state
- Production stops are not tracked reliably — data is scattered or missing
- Stop reasons are not recorded systematically
- Utilization is based on estimates, not measured actuals
- Management cannot see where time is really lost
- A heavy MES project feels too big as a first step
How Kare Pulse works in practice
Signal from the production point
One signal describing production progress is sent from each machine, line, or cell to the field device.
Automatic stop detection
The gateway mirrors channels to the cloud. The system creates stops based on thresholds and schedules.
Classifications from staff
Responsible users record reasons for system-created stops. Reminders for open stops.
Analytics and reports
Utilization, lost time, and reasons appear in reports — based on signals and classifications.
The gateway collects signals and mirrors them to the cloud
Production point signals are brought to the gateway through industrial I/O. The device builds a secure connection to Kare Pulse — without VPN or inbound ports opened in the customer network.
- Digital signals directly from production
- Real-time mirroring to the cloud service
- HTTPS outbound from the customer network
- Example device Beckhoff CX8200
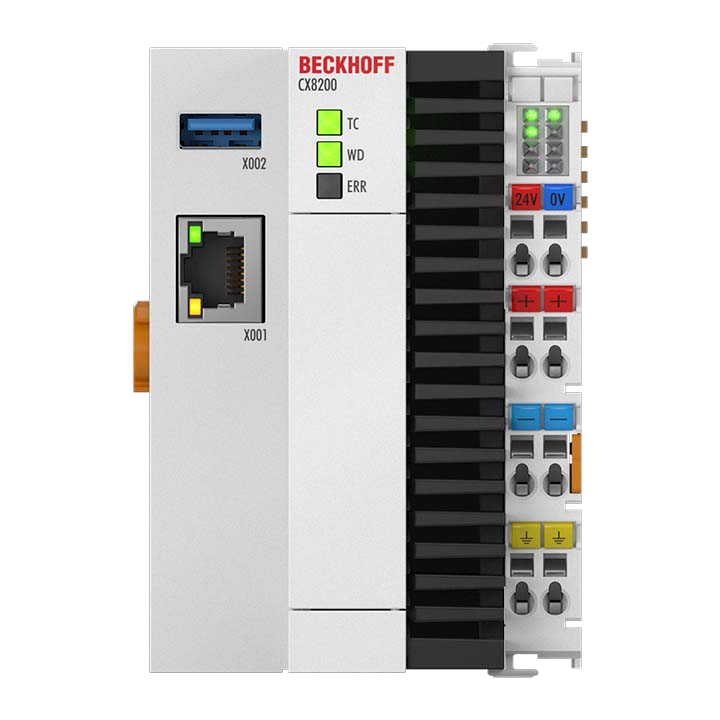 CX8200 gateway
Key production tracking views in daily use
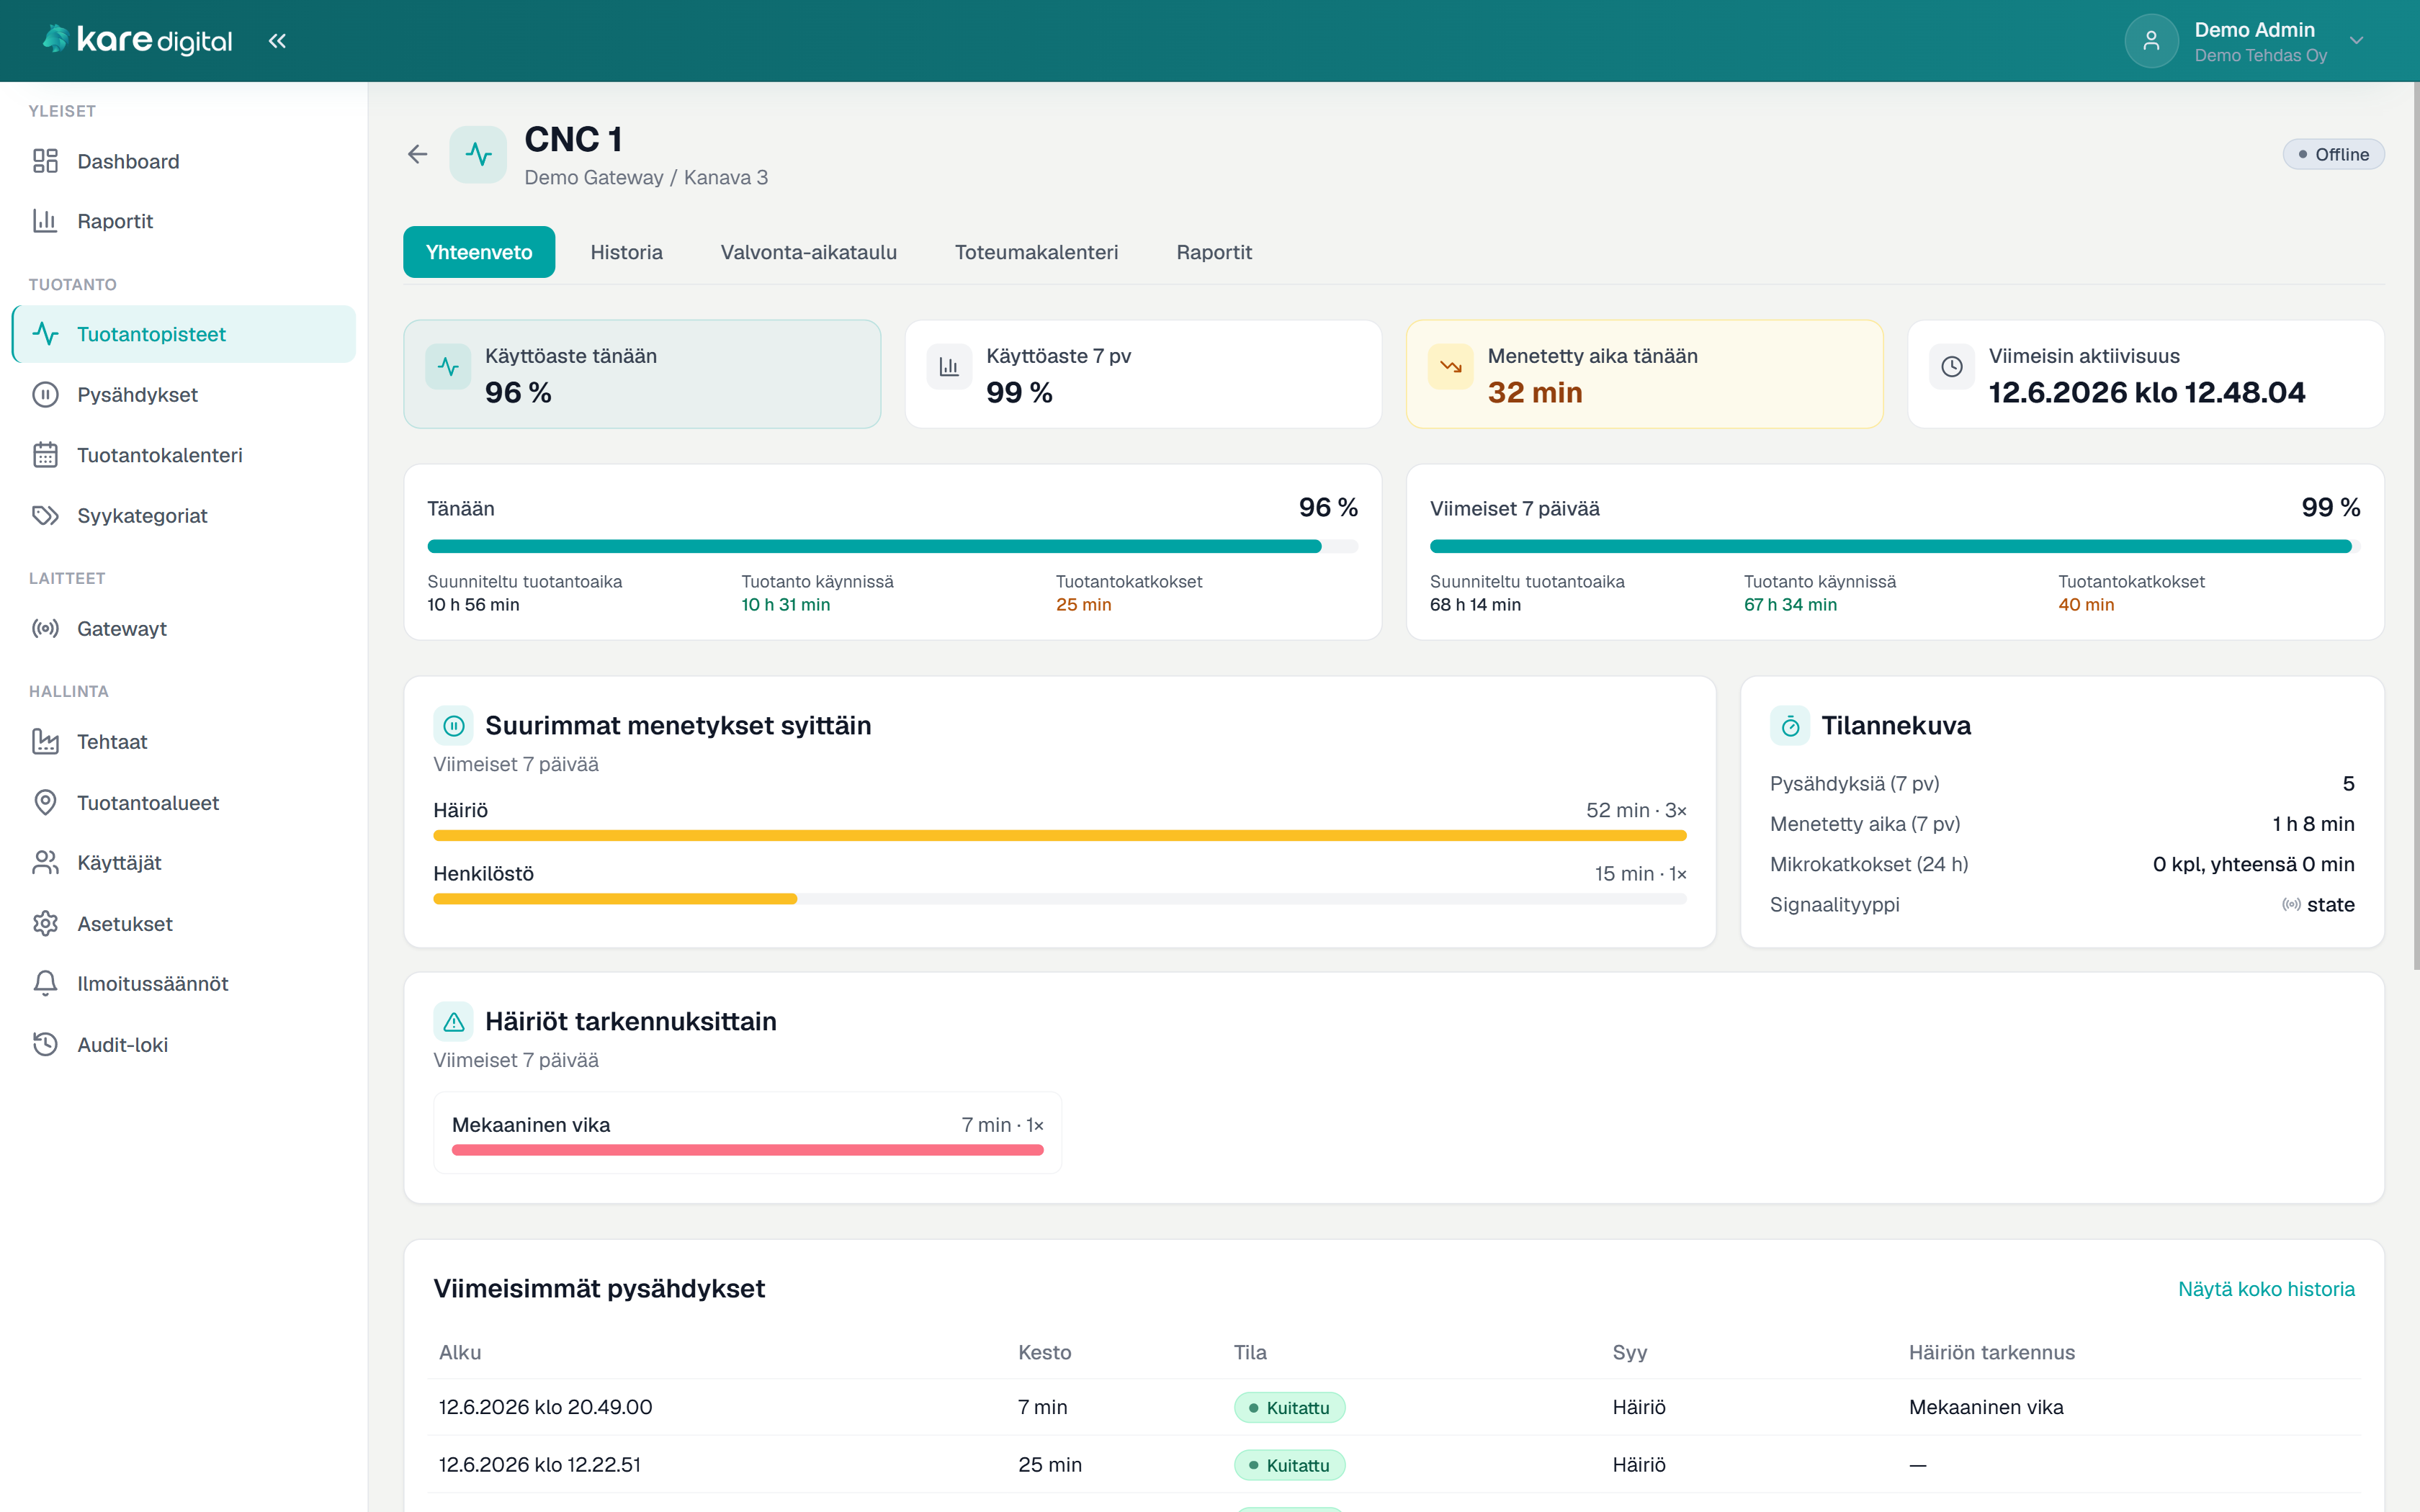
Utilization, lost time, and open stops in one view
The production point summary brings the situation together: running time, stops, unclassified events, and AI analysis for any period.
- Real-time status per point
- Lost time daily and weekly
- AI summary of recurring reasons
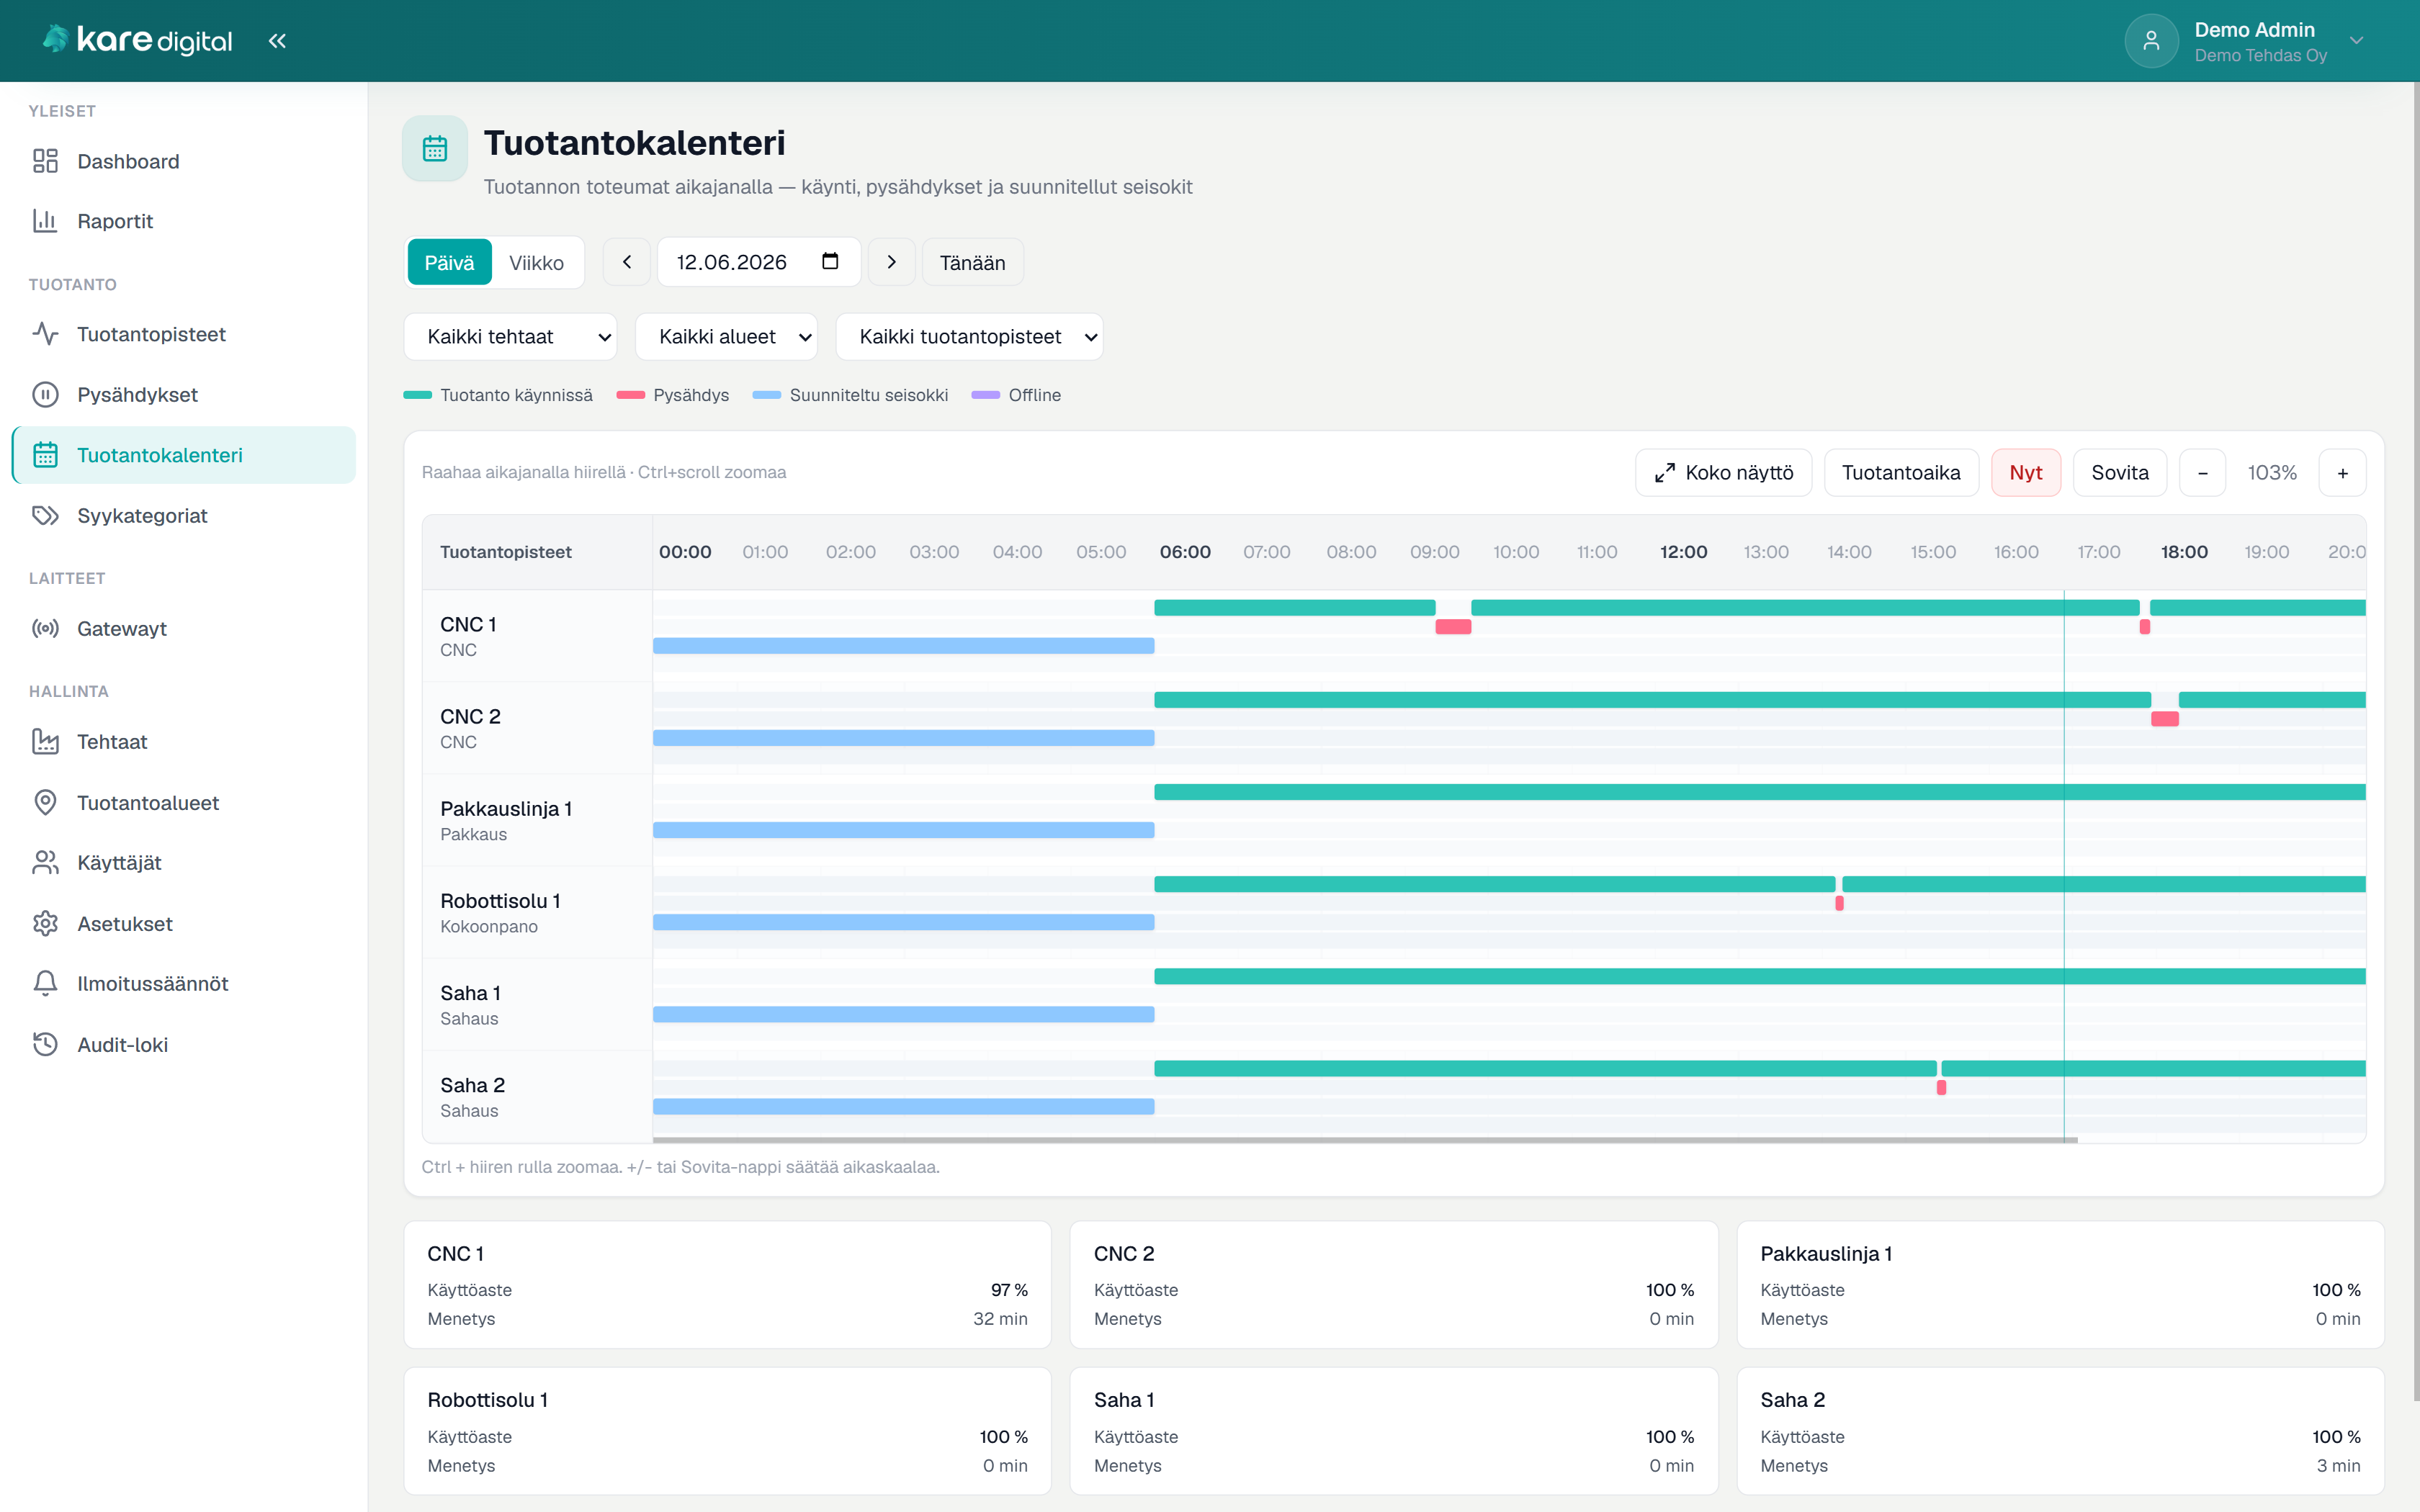
Actual production on a timeline — running, stops, and planned downtime
The signal chart separates running time, stops, scheduled breaks, and offline periods — readable at a glance without spreadsheets.
- Day and week views with a zoomable timeline
- Monitoring schedule in blocks
- Click a stop to open classification
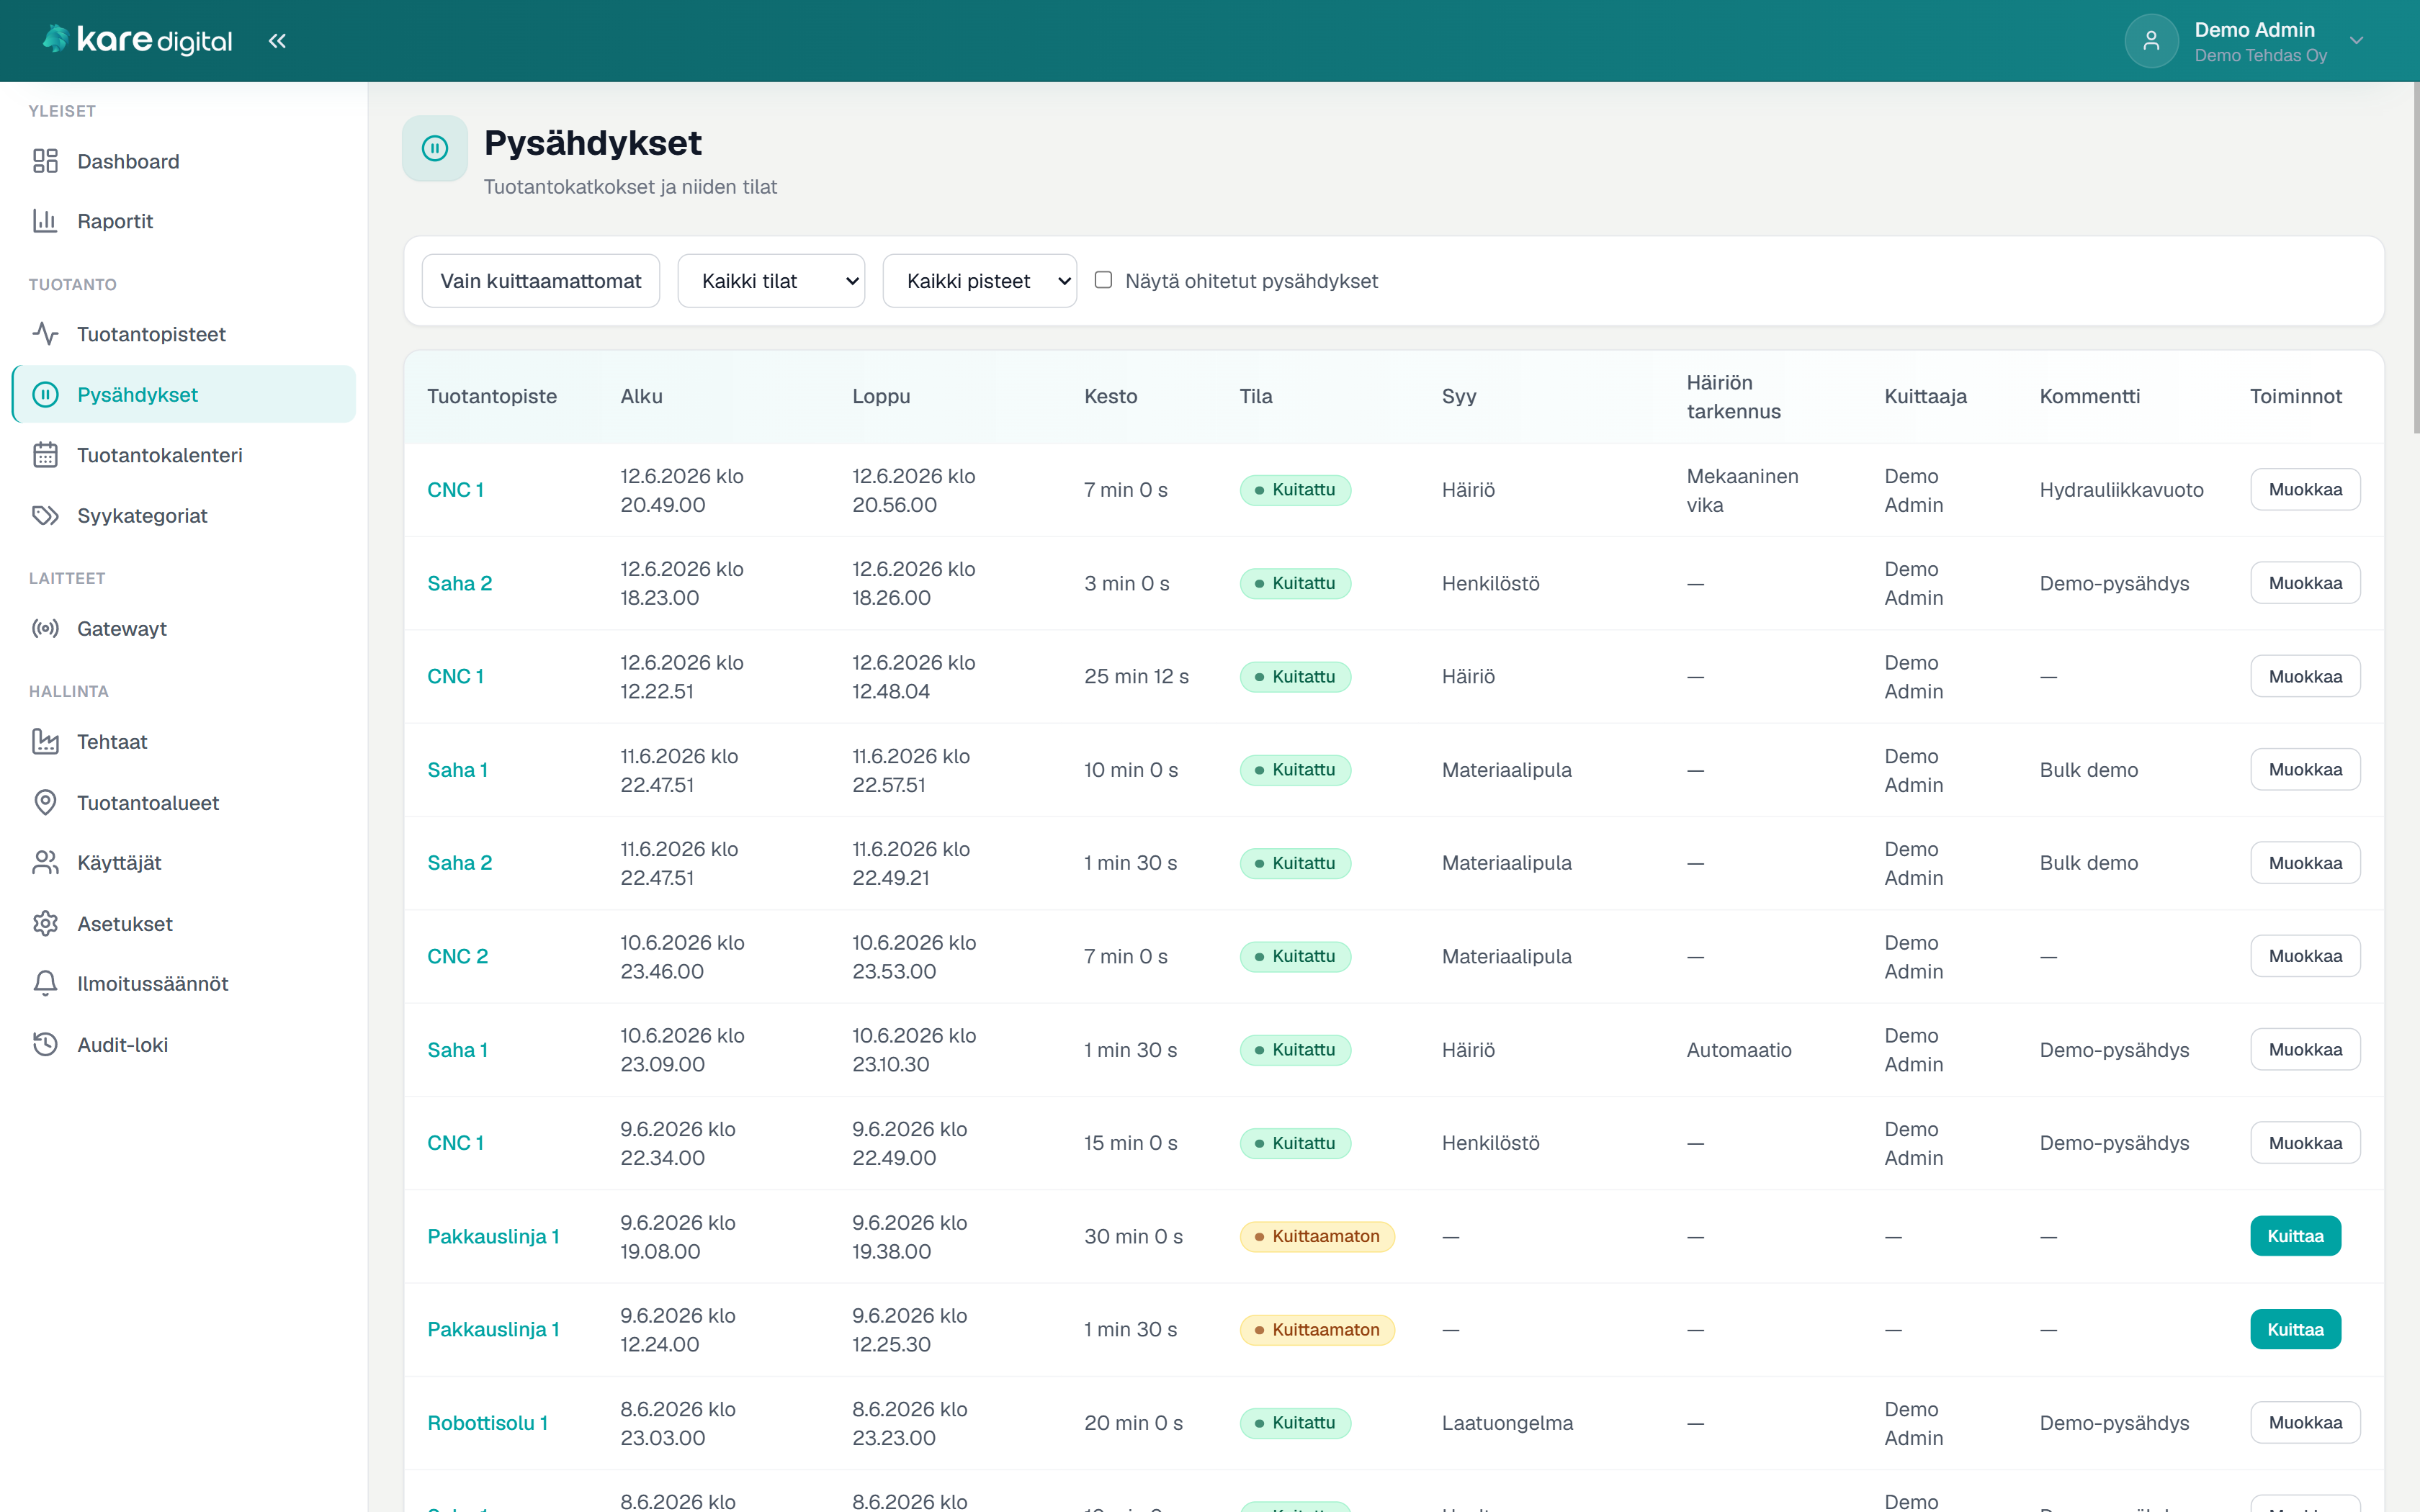
Classify reasons quickly — data is measured, reasons come from your team
The system detects downtime from signals. Staff pick a reason, add detail, and comment — only then are reports reliable.
- Unclassified stops in one list with reminders
- Reason categories and disturbance details
- Mobile classification in the browser
From signal to report — one whole
Monitoring and signals
- Run/stop monitoring per production point
- Automatic stop creation
- State, pulse, and heartbeat signals
- Gateway-based data collection
Classifications and reasons
- Stop reason recording
- Reason categories and disturbance details
- Unclassified stops in one list
- Email reminders to responsible users
Views and analytics
- Dashboard for real-time status
- Utilization tracking
- Production calendar on a timeline
- AI analysis for any date range
Structure and use
- Factories, areas, and production points
- HTTPS outbound from customer network
- Finnish and English
- Complements MES/ERP/CMMS environments
Pulse focuses on lost time
Pulse focuses on
- Collecting production progress signals
- Automatic stop detection via gateway
- Stop reason classifications
- Utilization, lost time, and bottlenecks
- Reports, disturbance breakdown, and AI summary
Not included
- Full MES or production planning
- Inventory, purchasing, or quality management
- Machine control changes
- Work orders and maintenance (→ Kare Maint)
- Project management (→ Kare Flow)
Industrial reality and lightweight onboarding — not a heavy MES project
- Practical development from real shop-floor situations
- Lightweight onboarding — no VPN or inbound open ports
- Complements existing MES, ERP, or CMMS environments
- The solution combines signals, a gateway device, and cloud service
- Support in Finnish and direct contact with the software developer
Clear pricing — software per factory
Software license per factory. Hardware and onboarding are priced separately based on scope.
Kare Pulse
- Includes 8 production points
- 79 €/mo per additional block of 4 production points
- Over 32 production points: price on request
Hardware: Gateway, I/O devices, enclosures, supplies, cabling, and installation priced per site based on scope.
Onboarding: System setup, production point configuration, gateway setup, testing, and training priced based on scope.
Want to see where production time goes?
Let's review your needs together and assess how signals and classifications fit your production environment.
Request a demoGet in touch
Tell us briefly about your situation. We will get back to you as soon as we can.